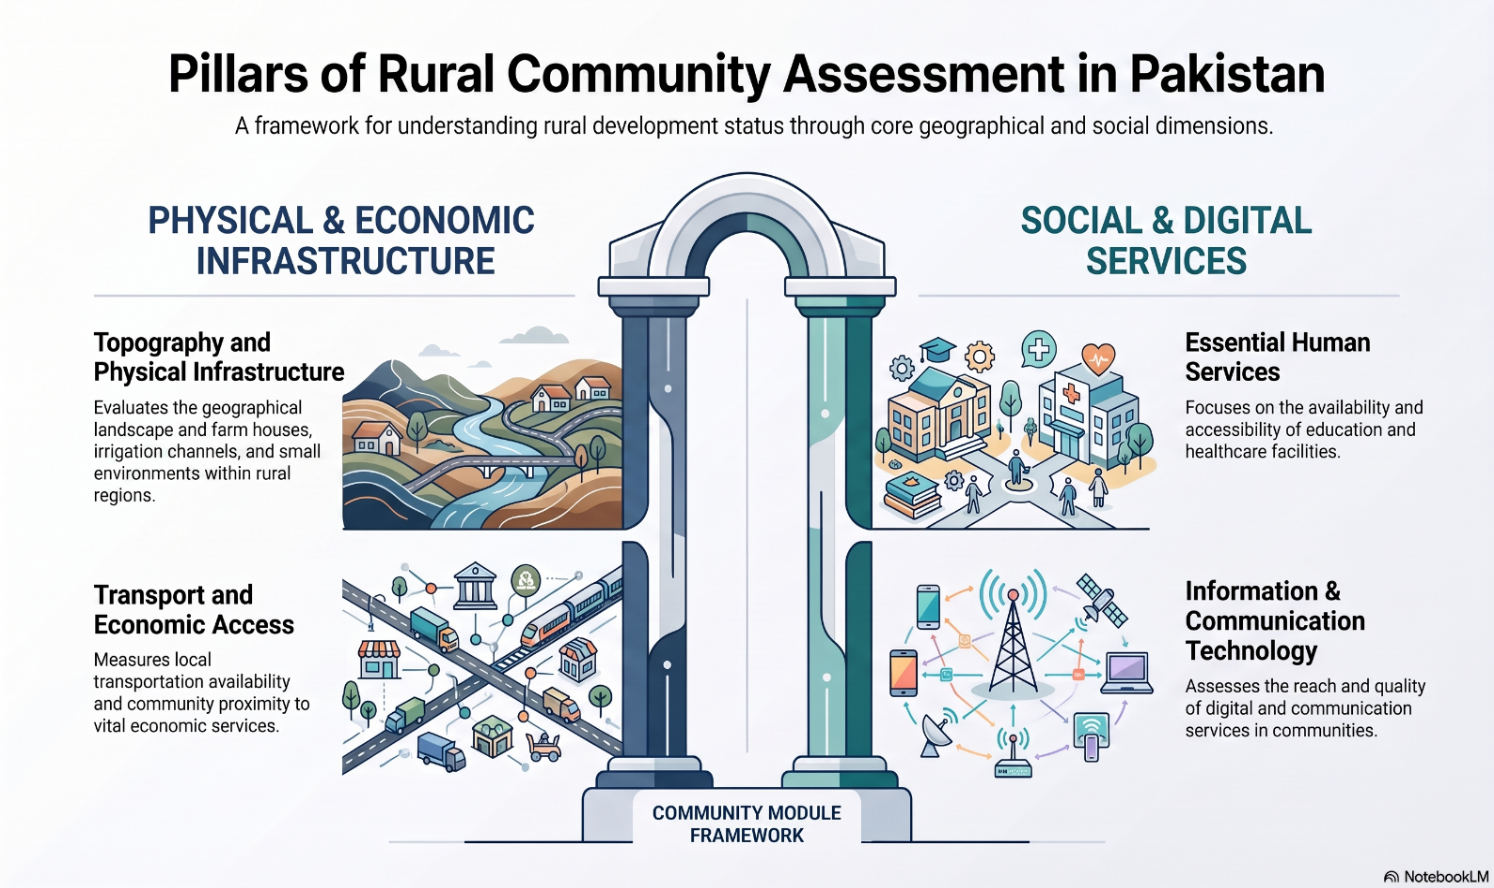
Youth Development Index (YDI)
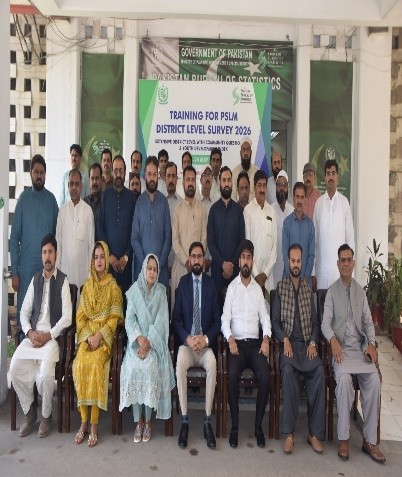
On the request received from the Prime Minister Office Youth Development Index (YDI) from UNFPA and SDPI has been included to PSLM (District)-level Survey 2026. The survey will deploy specialized tools and dedicated modules to collect comprehensive youth-related data to understand the needs, experiences and challenges of youth aged 15-29 Years across Pakistan. Its finding will support better education, employment, health and skill development programs.
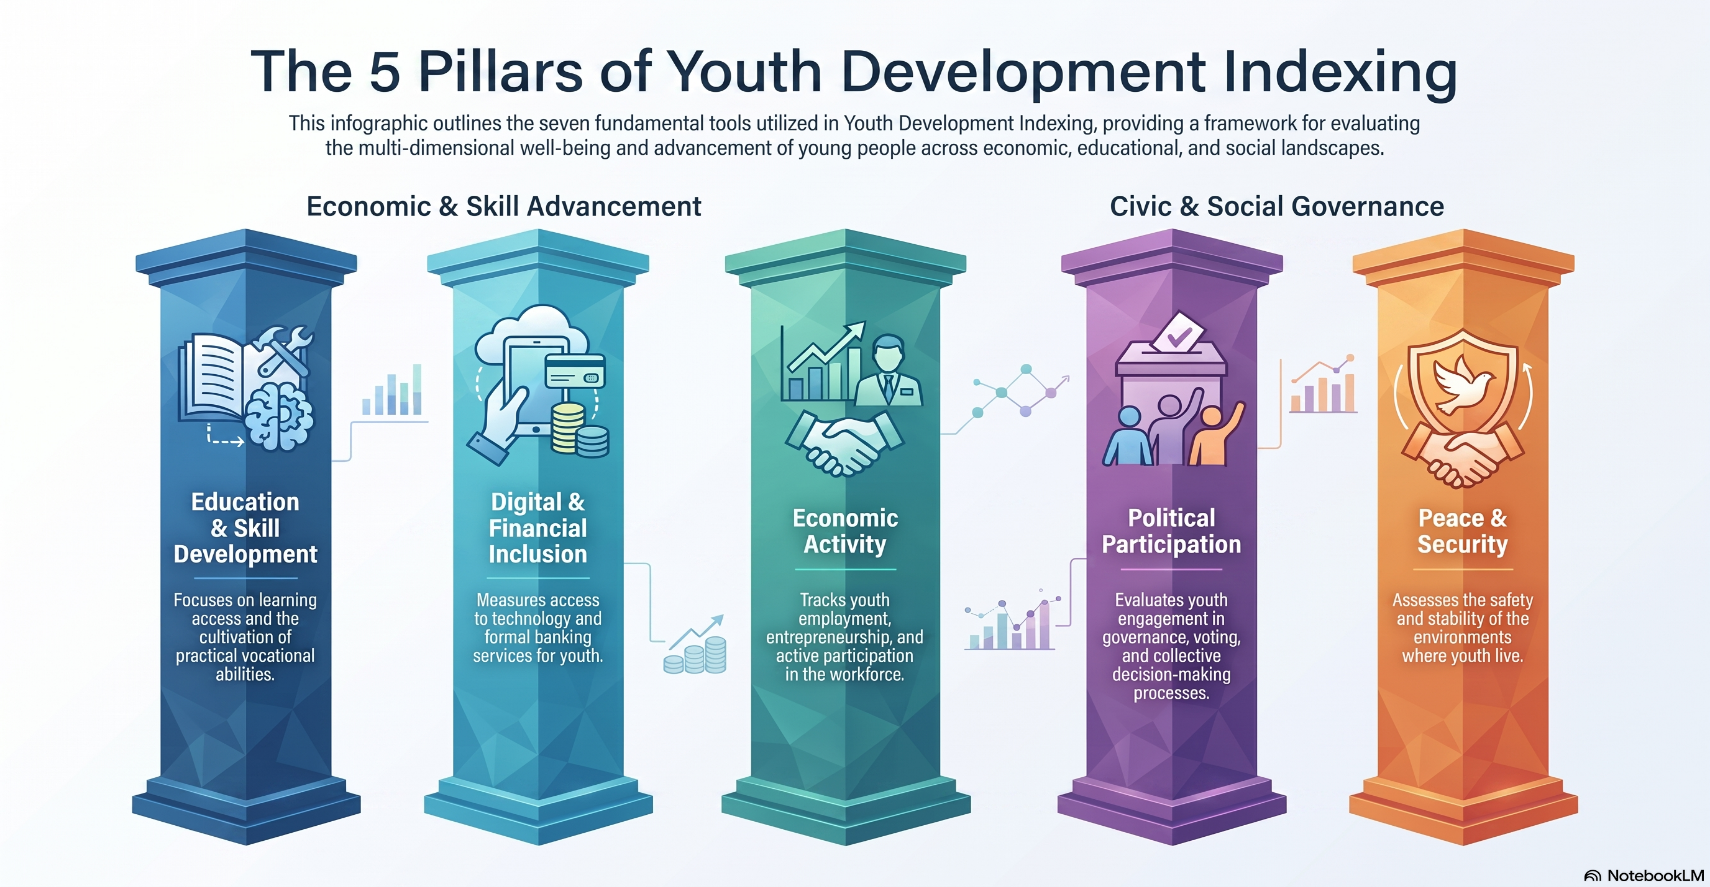
Pakistan Social and Living Standards Measurement (PSLM) Survey is a flagship household survey conducted by Pakistan Bureau of Statistics to generate reliable and timely data on key social and economic indicators. It plays a critical role in monitoring development outcomes across sectors such as Education, Health, Water and Sanitation, and Housing, at National and Sub-National Levels. PSLM is designed to support evidence-based policymaking and to track progress against national priorities and international commitments, including the Sustainable Development Goals. Using scientifically designed sampling frameworks, the survey ensures representative estimates that inform planning, resource allocation, and evaluation of public sector interventions in Pakistan. Sample Design for the latest survey will be uploaded soon.
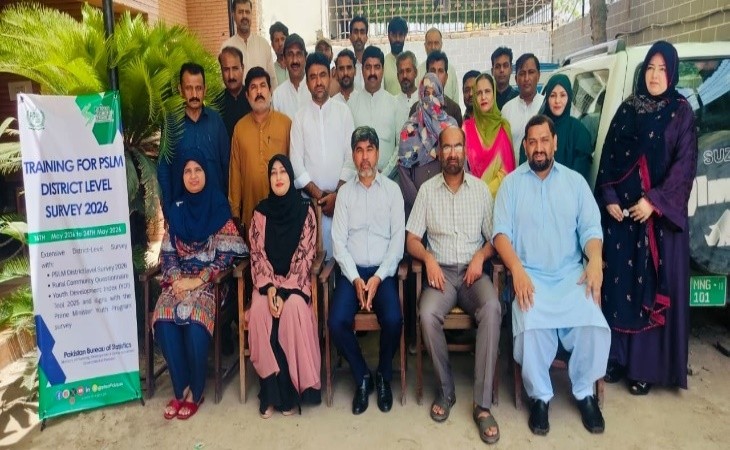
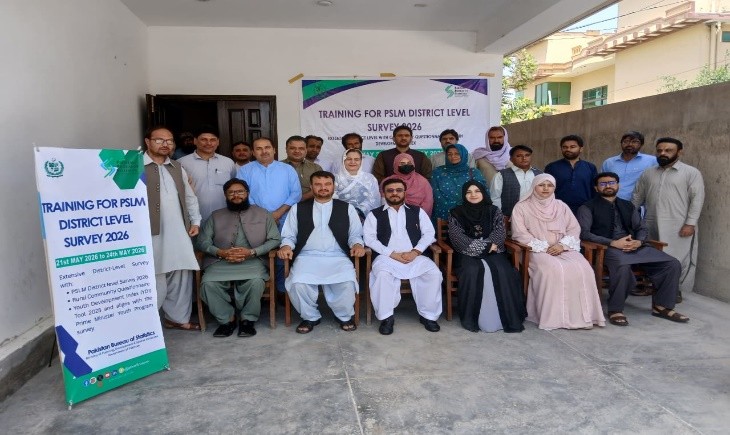
| Training Station | Training Dates | Regional Offices |
|---|---|---|
| Islamabad | 18 – 21 May, 2026 | Muzaffarabad, Rawalpindi, Gilgit Baltistan, D.I. Khan |
| Batch – I | ||
| Mingora | 16 – 19 May, 2026 | Peshawar, Bannu, Mingora, Abbottabad |
| Lahore-I | 16 – 19 May, 2026 | Lahore, Sahiwal |
| Karachi | 16 – 19 May, 2026 | Karachi, Hyderabad, Mirpur Khas |
| Faisalabad | 16 – 19 May, 2026 | Faisalabad, Jhang, Mianwali, Sargodha |
| Batch – II | ||
| Quetta | 21 – 24 May, 2026 | Khuzdar, Quetta, Loralai, Turbat |
| Lahore-II | 20 – 23 May, 2026 | Gujranwala, Sialkot, Bahawalpur, Bahawalnagar, Rahim Yar Khan |
| Multan | 21 – 24 May, 2026 | Multan, Vehari, D.G. Khan |
| Sukkur | 21 – 24 May, 2026 | Sukkur, Larkana, Shaheed Benazirabad, Dadu, Jacobabad |
Population aged 10 years and older that can read and write a simple statement with understanding in any language expressed as percentage of total population aged 10 years and older.
Numerator of Literacy: – Population aged 10 years and older that is literate.sc1q01a(can a person read simple statement in any language with full understanding)=1 and sc1q02a(can a person write simple statement in any language with full understanding =1
Denominator of Literacy: – Population aged 10 years and older.
Disaggregated analysis by, age group, gender, region, and by quintile (only at provincial level) etc. are available in reports.
Out of School consists of those children age 5-16 years who have never been to school and those children who attended school and left afterwards.
Out of School =Never been to School + Dropout
Never Been to School:
Numerator: – Raised sum of all individuals aged 5-16 years who reported never been to school in educational status.
Denominator: -Raised sum of all individuals aged 5-16 years.
Dropout:
Numerator: – Raised sum of all individuals aged 5-16 years who reported attended school in the past(dropout).
Denominator: -Raised sum of all individuals aged 5-16 years
Disaggregated analysis by, age group, gender, region, and by quintile (only at provincial level) etc. are available in reports.
Net enrolment rate: [Number of children aged 6-10 years attending Primary level (classes 1-5) divided by number of children aged 6-10 years] multiplied by 100.
Numerator of NER: Raised sum of all individuals aged 6-10 years who report currently attending primary level class (1-5).
Denominator of NER: Raised sum of all individuals aged 6-10 years.
Disaggregated analysis by, age group, gender, region, and by quintile (only at provincial level) etc. are available in reports.
Net enrolment rate: [Number of children aged 11-13 years attending Middle Level (classes 6-8) divided by number of children aged 11-13 years] multiplied by 100.
Numerator of NER: Raised sum of all individuals aged 11-13 years who report currently attending Middle level class (6-8).
Denominator of NER: Raised sum of all individuals aged 11-13 years
Disaggregated analysis by, age group, gender, region, and by quintile (only at provincial level) etc. are available in reports.
Net enrolment rate: [Number of children aged 14-15 years attending Matric Level (classes 9-10) divided by number of children aged 14-15 years] multiplied by 100.
Numerator of NER: Raised sum of all individuals aged 14-15 years who report currently attending Matric level class (9-10).
Denominator of NER: Raised sum of all individuals aged 14-15 years.
Disaggregated analysis by, age group, gender, region, and by quintile (only at provincial level) etc. are available in reports.
Children aged 12-23 months who reported having received full immunization who also have an immunization card, expressed as a percentage of all children aged 12-23 months. To be classified as fully immunized a child must have received: ’BCG’, PENTA1, PENTA2, PENTA3, PNEUM1, PNEUM2, PNEUM3, Polio0, Polio1, Polio2, Polio3, IPV and Measles1.
Computation Method: –
It is calculated for all children who had a health card, using all immunizations reported, and these were recorded on the card. It is likely that all will have been recorded on the card.
Full immunization means that the child has received: BCG, PENTA1, PENTA2, PENTA3, PNEUM1, PNEUM2, PNEUM3, Polio0, Polio1, Polio2, Polio3, IPV and Measles1.
Disaggregation:
Disaggregated analysis available by gender, region, and by quintile (only at provincial level) etc.
Ever married women aged 15 – 49 years who had given birth in the last three years and who had attended at least one pre-natal consultation during the last pregnancy, expressed as a percentage of all ever married women aged 15 – 49 years who had given birth in the last three years.
Computation Method:-
Currently married women aged 15 – 49 years who had given birth in the last three years and who had attended at least one pre-natal consultation during the last pregnancy, expressed as a percentage of all currently married women aged 15 – 49 years who had given birth in the last three years.
Currently married women aged 15-49 years who had given birth in the last three years and who had attended a pre-natal consultation at the source indicated expressed as a percentage of all of the same women who had had a pre-natal consultation.
Disaggregation:
Disaggregated analysis available by gender, region, and by quintile (only at provincial level) etc.
UN has adopted new development plan for post 2015 monitoring called Sustainable Development Goals (SDGs). Under SDGs, initially there were 17 goals, 169 targets and approximately 505 indicators, after review and input from all member states now the indicators are reduced to 234 with 17 goals and 169 targets. SDGs have extensive and wider agenda tam MDGs and it put greater emphasis on disaggregation at all levels. Therefore it will be important to improve the availability and access to data and statistics disaggregated by income, gender, age, race, ethnicity, migratory status, disability, geographic location and other characteristics relevant in national context.
As mentioned above PSLM survey was one of the main mechanism for monitoring of MDGs, therefore keeping in view the new development agenda of SDGs and changing ground realities, Technical committee for PSLM has been reconstituted with the approval of Chief Statistician to review the PSLM Questionnaire and recommend necessary amendments/inclusions.
| Indicator | Definition | 2018-19 | 2019-20 | ||||
| 1.2.2 | Proportion of men, women, and children of all ages living in poverty in all its dimensions according to national definition | – | 14.6 | ||||
| 2.1.2 | Prevalence of moderate or severe food insecurity in the population, based on the Food Insecurity Experience Scale (FIES) | 16% | |||||
| 3.1.2 | Proportion of births attended by skilled health personnel. | 68% | |||||
| 3.b.1 | Proportion of the target population covered by all vaccines included in their national program | 68% | 70% | ||||
| 4.1.2 | Completion rate (primary education, lower secondary education, upper secondary education) | (a) 66% | (a) 67% | ||||
| (b) Lower Secondary | (b) 46% | (b) 47% | |||||
| (c) Upper Secondary | (c) 21% | (c) 23% | |||||
| 4.2.2 | Participation rate in organized learning (one year before the official primary entry age), by sex | 32% | 19% | ||||
| 4.6.1 | Percentage of population in a given age group achieving at least a fixed level of proficiency in functional (a) literacy and (b) numeracy skills, by sex. | 60% | 60% | ||||
| 5.b.1 | Proportion of individuals who own a mobile telephone, by sex | 45% | |||||
| 6.1.1 | Proportion of population using safely managed drinking water services. | 95% 69% | 94% 74% | ||||
| 6.2.1 | Proportion of population using safely managed sanitation | (a) 70% | (a) 68% | ||||
| (b) Specific place of hand-washing facility with soap and water. | (b) 50% | (b) 54% | |||||
| 7.1.1 | Proportion of population with access to electricity | 91% | 91% | ||||
| 7.1.2 | Proportion of population with primary reliance on clean fuels and technology | 35% | 37% | ||||
| 9.1.1 | Proportion of the rural population who live within 2 km of an all-season road | – | 88% | ||||
| 11.2.1 | Proportion of population that has convenient access to public transport by sex, age, and persons with disabilities. | 44% | |||||
| 17.8.1 | Proportion of individuals using the Internet. | 17% | 19% | ||||